
Hypervolume Indicator
The Hypervolume Indicator (HV), originally proposed by Zitzler and Thiele [11], is a widely used scalar measure for assessing the quality of a Pareto front obtained from a multi-objective optimization. It quantifies how well a set of solutions covers the objective space relative to a chosen reference point
Geometrically, the hypervolume is the
where
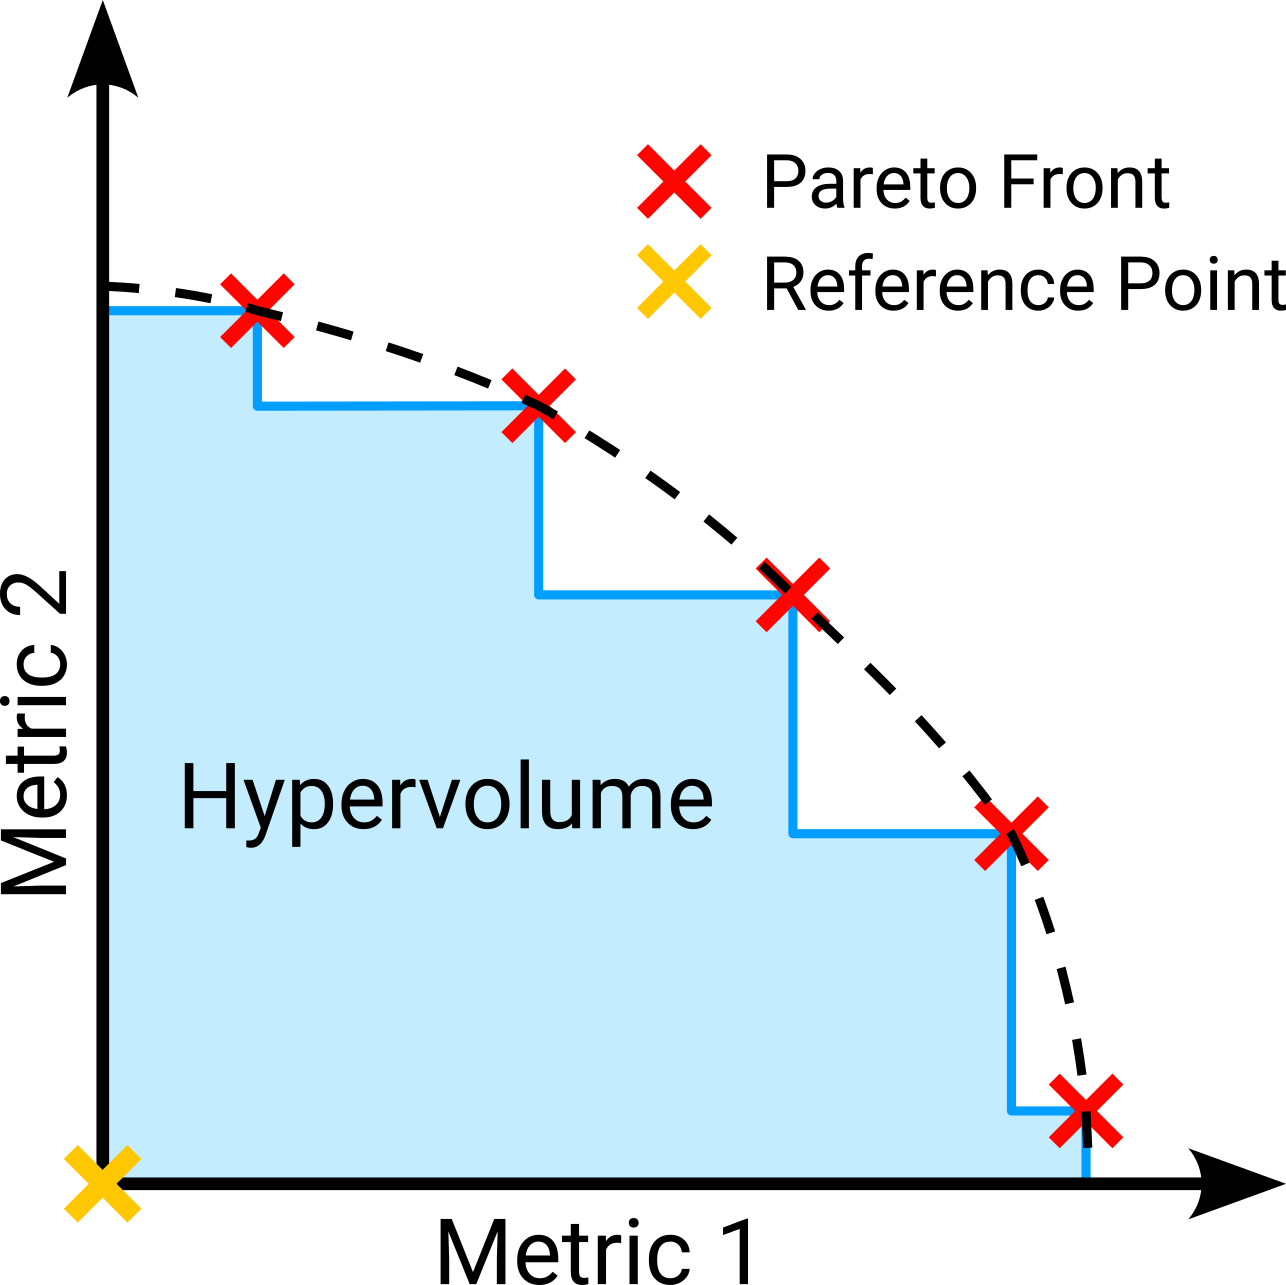
A larger hypervolume indicates a better Pareto front: solutions that are closer to the true optimum and more spread out across the trade-off surface contribute more volume. This makes the indicator particularly useful for comparing the output of different optimizers or tracking optimization progress, as it captures both convergence toward the Pareto front and diversity of the solution set in a single number.
In the context of TI planning, the hypervolume indicator is used to evaluate the quality of the Pareto front produced by the SuMo optimizer over the three exposure quality metrics M1 (strength), M2 (selectivity), and M3 (collateral).